



Your marketing report shows more clicks, better rankings, and another month of rising traffic. Yet you still can’t tell which channels brought in cases or what those cases cost. Sound familiar? It’s not great, but let me offer you some consolation. Most firms I work with for the first time as their fractional law firm CMO don’t have this problem. They actually see barely any marketing reporting at all.
Whether you’re in the former or the latter group, I’m sure that by now you understand the importance of data and revenue attribution; otherwise you wouldn’t have found this guide. Metrics and hard numbers are key to making important decisions about your firm, and the more clarity you have around your marketing spend, the better.
I usually want eight numbers in front of the partners: qualified leads, consultations booked, consultations held, signed cases, cost per signed case, signed or estimated fees, open pipeline, and spend against plan. Actually, there are nine, and the last one is a wildcard I’ll share with you towards the end. For now, let’s go through everything you need to close the gap between your marketing spend and marketing ROI.
Key Insights
- Track eight core numbers each month to connect marketing spend with qualified leads, signed cases, and fees.
- Break results down by channel, practice, and office so firmwide averages don’t hide weak performance.
- Use the report to explain what changed, why it changed, and what the firm should do next.
Why most law firm marketing reports measure the wrong things
Marketing vendor reports often lead with the work that vendor controls. An SEO agency reports rankings. An advertising agency reports clicks and leads. Those numbers help explain performance on the surface, but they don’t tell the partners whether the firm signed the cases it wanted.
The Rankings.io 2025 survey illustrates the disconnect. Marketing ROI was the first budget priority for partners, yet marketers prioritized maximizing leads and attorneys wanted intake to work every lead properly.
The test for well-structured marketing reporting is simple: does it help explain how the firm gets clients, earns fees, or spends money? If it only describes activity and not outcomes, it needs to be reworked.
The top marketing metrics a law firm partner should track
The examples below use Pioneerly’s 2026 personal injury marketing data. Each benchmark has its own sample, so don’t multiply the stage rates into a funnel. Your firm should use its own conversion rates and case economics.
1. Qualified leads by channel
Count unique prospective matters that fit the firm’s case criteria and jurisdiction, grouped by their originating channel. How do you know the originating channel in a world where every client has had multiple touchpoints with your firm before reaching out and analytics show a huge chunk of users coming from a “direct” source? There’s really one good way: ask every potential client, and do it at the beginning of the consultation. While they might have gone through multiple channels to land on your calendar, what they say to you is usually what influenced them the most. Record it in your case management system or CRM alongside the source attributed by your analytics software.
Keep unsuitable inquiries and duplicate contacts separate. This shows whether marketing attracts work the firm wants. Our PI benchmark puts qualified leads at 43.7% of inquiries on average. Calling every inquiry a qualified lead can more than double the apparent result, so don’t do that.
2. Consultations booked
Count confirmed appointments with a named attorney or intake specialist. A callback attempt doesn’t qualify. This number shows whether suitable prospects get a clear next step. Our PI average is 70.7% of qualified leads booking a consultation, versus 83.7% in the top quarter. Counting repeated bookings for the same matter inflates the result.
3. Consultations held
Count consultations that actually happened. Show no-shows as a share of appointments due, with cancellations and rescheduling recorded separately. Our PI consultation attendance benchmark is 81.4%, versus 98.6% in the top quarter. Treating every booked appointment as attended hides part of the gap between leads and signed cases. Partners need to see where prospects stop moving forward.
4. Signed cases
Count signed retainers or engagement letters by signing date, carrying the original source into the case record. This is the result the earlier stages should produce. Our PI benchmark shows 34.3% of consultations becoming signed cases, versus 66.0% in the top quarter. Cases still being assessed by intake aren’t signed cases, however promising they look.
Build a better case acquisition system for your law firm.
Tell us about your firm and your goals. We’ll give you our honest take on how to get there.
5. Cost per signed case by channel
Divide each channel’s monthly spend, including management fees and allocated shared costs, by cases signed from that channel. Show a trailing three-month figure alongside it because spending and signing happen at different times. Keep zero-case channels visible with their spend. A blended average can hide them. Our personal injury marketing benchmarks report $2,956 per signed case overall, compared with $1,631 in the top quarter.
6. Signed fees or estimated case value
Show agreed fees for new flat-fee matters and estimated fees for hourly or contingency matters. For contingency work, use the firm’s historical average fee by case type, including matters that earn nothing. This helps partners judge whether acquisition costs make sense. Label estimates clearly. A retainer deposit isn’t total case value, and cash collected from old matters isn’t this month’s marketing return.
7. Open pipeline
Count qualified prospective matters that remain unsigned and haven’t been declined or closed, once each. Show their age and next action. A growing pipeline with flat signings calls for a review of follow-up, appointment availability, and case fit. Partners need to know what could still convert. Leaving dead prospects open makes a stalled pipeline look healthy.
8. Spend against plan
Show spending by channel against the approved monthly budget, plus the quarter-to-date total. Include agency fees, tools, and allocated intake costs, with the allocation stated. Partners should see the full acquisition bill and any departure from the plan. Reporting only advertising spend makes both the budget and cost per case look better than they are.
Best marketing tracking strategy? Measure everything.
Impressions, clicks, click-through rates, rankings, reviews, website sessions, and hundreds of other metrics a marketer can think of should all be tracked and used to build reports. They all show different things and can show progress during the initial stages of a new marketing strategy. They just don’t belong on the main executive dashboard. Use them to explain a change: fewer qualified inquiries may follow a ranking decline, while rising clicks with flat signings may point to poor targeting or an intake problem.
How to credit a case when several channels helped
At Pioneerly, we use the first identifiable touchpoint as the originating channel: a tracked call, submitted form, Local Services Ads lead, or named referral. Keep that source attached to the matter through signing. If intake records another influence, show it separately as an assist, without counting the case twice.
A prospect might hear about the firm from a friend, read reviews, then call. The referral gets the originating credit; reviews helped. Maps can also be the originating source when the first contact is a tracked call from the listing. It shouldn’t automatically lose credit because it often assists other channels.
Channel-specific tracking, captured source details, and intake asking how the person found the firm make this possible. Leave genuinely unknown sources visible.
What the one-page report should look like
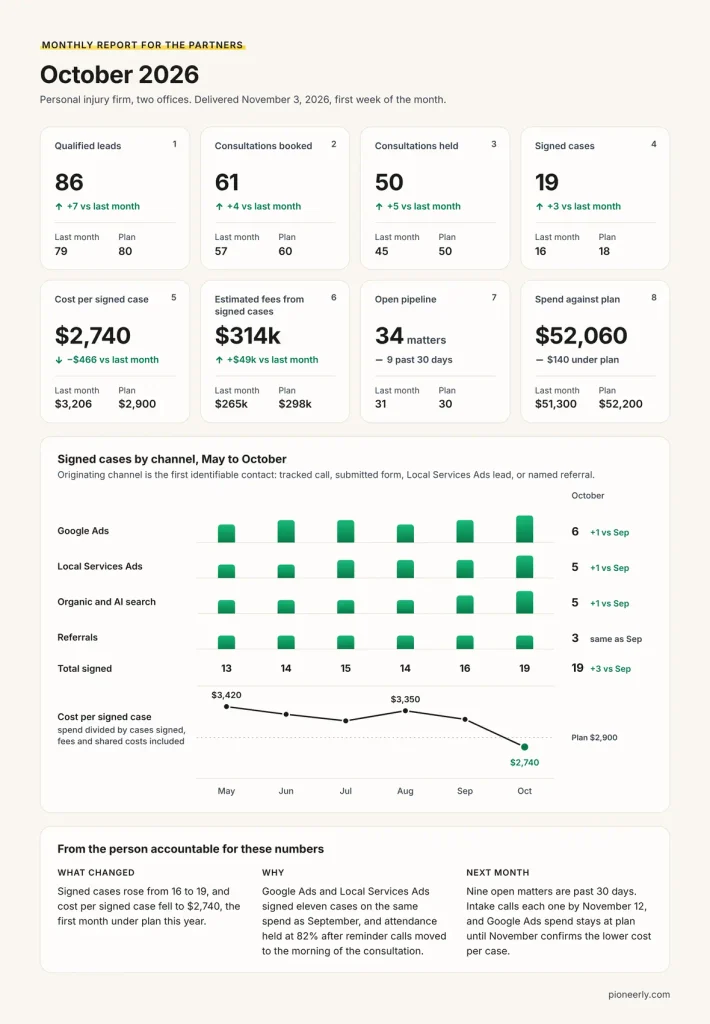
Your executive marketing report should take two minutes to read before a partner meeting. Put the eight numbers at the top, with this month, last month, and plan. Below them, show six months of signed cases by channel and a clearly labeled cost-per-case line.
Finish with three sentences from the person accountable: what changed, why, and what happens next. “Leads increased” isn’t enough. Explain whether that increase produced more suitable cases and what the firm will do with the finding.
Deliver the same layout in the first week of every month. The example report included here shows the format, using illustrative figures.
A wildcard metric to include in your marketing reporting
I promised to talk about this, so here it is. Marketing is never an exact science, no matter how much data we have and how much we try to make it predictable. So, instead of fighting the uncertainty, I recommend embracing it. That’s why I always leave a little bit of time and budget for marketing experiments. Every month, I go for one or a few high-risk, high-reward initiatives. We try new things, often based on our gut feeling stemming from decades of marketing experience. Over the course of the year, these usually bring real value to the firm, and there have been multiple occasions when what started as an experiment ended up as one of the most profitable case acquisition channels for the firm. I can no longer imagine a marketing report that doesn’t leave some space for experiments.
What changes across practices and offices
Keep the same eight numbers, but separate practices and offices before showing the firmwide total. A blended figure can conceal an expensive channel or a practice attracting work with poor margins.
Market differences also matter. Pioneerly’s PI benchmarks put acquisition cost at $958 to $2,397 in small markets and $3,756 to $6,995 in the twenty biggest metros. One office’s higher cost doesn’t establish worse performance.
Allocate shared spending by identifiable campaigns and leads where possible. For genuinely shared costs, agree on a consistent allocation and state it. Compare acquisition costs with each practice’s expected fees and delivery costs.
What to do with this next month
Send these eight numbers to whoever prepares your report. Ask for them in the first week of next month. If they can’t come up with a value for any given metric, it means the tracking needs to be reworked, with an owner clearly assigned and a deadline set.
This is the week-one report our fractional CMO for law firms delivers. Our law firm marketing plan uses the same approach.
A marketing report that can’t tell you how many cases were signed and what each cost is a vendor invoice with charts.