Hartley County
4,904 residents
Need for legal services 53.5 (middle)




Data last updated
Hover over a county for a quick summary, or click or tap it for details. Switch views to compare legal practices, the need for legal help, and the gap between them.
The State Bar of Texas lists no active in-state attorneys in these counties as of December 31, 2025.
4,904 residents
Need for legal services 53.5 (middle)
3,692 residents
Need for legal services 47.6 (middle)
2,781 residents
Need for legal services 54.4 (high)
2,737 residents
Need for legal services 58.1 (high)
2,267 residents
Need for legal services 69.1 (highest)
1,783 residents
Need for legal services 53.6 (middle)
1,128 residents
Need for legal services 36.4 (lowest)
674 residents
Need for legal services 38.3 (lowest)
192 residents
Need for legal services 51.1 (middle)
Harris, Dallas, Travis, and Bexar counties are home to 35% of Texans.
All 15 Texas counties with fewer than 4 legal practices per 10,000 residents, by population. Click a county to see it on the map.
| County | Residents | Law offices with staff | Solo practices | Practices per 10,000 |
|---|---|---|---|---|
| Coryell County | 85,592 | 6 | 9 | 1.8 |
| Hale County | 31,819 | 7 | under 3 | 2.8 |
| Cass County | 28,651 | 4 | 7 | 3.8 |
| Gaines County | 23,956 | under 3 | under 3 | 1.7 |
| Willacy County | 19,971 | 3 | 4 | 3.5 |
| Hutchinson County | 19,633 | 4 | under 3 | 3.1 |
| Andrews County | 18,914 | under 3 | under 3 | 2.1 |
| Frio County | 18,823 | under 3 | 3 | 2.7 |
| Deaf Smith County | 18,626 | 5 | under 3 | 3.8 |
| Leon County | 16,894 | under 3 | 4 | 3.6 |
| Karnes County | 15,018 | under 3 | under 3 | 2.7 |
| Callahan County | 14,491 | under 3 | 3 | 3.5 |
| Zapata County | 13,753 | under 3 | 3 | 3.6 |
| Lamb County | 12,579 | under 3 | under 3 | 3.2 |
| Red River County | 11,816 | under 3 | under 3 | 3.4 |
Highest gap scores among Texas counties with 10,000 or more residents
"Under 3" means the unpublished Census count is 0, 1, or 2. Cass County's gap score of +79 means it ranks much higher for legal need than for legal practices per resident.
Looking to expand your law firm in Texas? Pioneerly helps you develop a growth strategy and build a complete case acquisition system focused on the cases your firm wants more of.
99,867* active lawyers live in Texas.
That's 31.5 per 10,000 residents, compared with 39.8 across the U.S. The count rose 7.6% over five years.
Source: American Bar Association, National Lawyer Population Survey 2025.
101,162* licensed attorneys are based in Texas, according to the State Bar of Texas.
Source: State Bar of Texas, active in-state attorneys, December 31, 2025.
13,833 law offices with paid staff operate in Texas.
25,610 solo practices operate in Texas.
These are legal services businesses with no paid employees.
*The American Bar Association and the State Bar of Texas count lawyers in different ways.
Straight-line distance from the center of each legal desert and county with no licensed attorneys to the center of the nearest county with 7 or more legal practices per 10,000 residents. The 15 farthest of 24 are shown.
| County | Residents | Nearest county with 7 or more | Miles |
|---|---|---|---|
| King County | 192 | Childress County | 63 |
| Sherman County | 2,781 | Potter County | 61 |
| Gaines County | 23,956 | Lynn County | 56 |
| Culberson County | 2,267 | Jeff Davis County | 55 |
| Frio County | 18,823 | Uvalde County | 52 |
| Deaf Smith County | 18,626 | Potter County | 50 |
| Hartley County | 4,904 | Potter County | 50 |
| Andrews County | 18,914 | Midland County | 47 |
| Lamb County | 12,579 | Lubbock County | 44 |
| Hutchinson County | 19,633 | Potter County | 43 |
| Oldham County | 1,783 | Potter County | 40 |
| Zapata County | 13,753 | Starr County | 40 |
| Karnes County | 15,018 | Bee County | 34 |
| Hale County | 31,819 | Lubbock County | 32 |
| Red River County | 11,816 | Franklin County | 32 |
The six measures that make up the need for legal services, each tied to a practice area, with the county where it's highest among those with 10,000 or more residents.
Highest: Fort Bend County, 30.5%
Highest: Ward County, 67.4
Highest: Zapata County, 38.4%
Highest: Pecos County, 20.2%
Highest: Llano County, 37.0%
Highest: Kaufman County, 24.2
State and U.S. figures are county figures weighted by population. Fatal crashes are the yearly average for 2023 and 2024, and bankruptcy filings are for 2025.
These counties gained residents from 2020 to 2025 and had fewer law offices with paid staff in 2023 than in 2018. The 8 fastest-growing are shown.
| County | Residents | Change since 2020 | Law offices, 2018 | Law offices, 2023 |
|---|---|---|---|---|
| Liberty County | 121,364 | +31.2% | 35 | 29 |
| Rockwall County | 140,738 | +28.9% | 49 | 47 |
| Parker County | 184,767 | +23.5% | 44 | 43 |
| Hunt County | 123,336 | +23.0% | 19 | 17 |
| Wise County | 83,778 | +21.5% | 21 | 14 |
| Bastrop County | 118,908 | +21.3% | 19 | 16 |
| Johnson County | 218,048 | +20.5% | 46 | 39 |
| Blanco County | 13,581 | +18.6% | 4 | 3 |
Population change is July 2020 to July 2025, from the Census Population Estimates. Law offices with paid staff are from Census County Business Patterns, which publishes counts of 3 or more. The statewide office change covers the 139 counties with both counts published.
We can rank all 254 Texas counties by population growth, legal need, and the legal practices already there, for the practice areas your firm wants more of.
Contact usSort by any column, or type a name to filter. Click a county to see it on the map.
| How much people in the county are likely to need a lawyer, from 0 (least in the U.S.) to 100 (most). | How far the need for legal help runs ahead of local legal practices. Above 0 means more need than practices. | ||||
|---|---|---|---|---|---|
| Culberson County | 2,267 | No licensed attorneys | 0 | 69.1 | +93.4 |
| Fisher County | 3,692 | No licensed attorneys | 0 | 47.6 | +43.0 |
| Glasscock County | 1,128 | No licensed attorneys | 0 | 36.4 | +15.8 |
| Hall County | 2,737 | No licensed attorneys | 0 | 58.1 | +71.6 |
| Hartley County | 4,904 | No licensed attorneys | 0 | 53.5 | +59.2 |
| Kent County | 674 | No licensed attorneys | 0 | 38.3 | +19.6 |
| King County | 192 | No licensed attorneys | 0 | 51.1 | +53.5 |
| Oldham County | 1,783 | No licensed attorneys | 0 | 53.6 | +59.4 |
| Sherman County | 2,781 | No licensed attorneys | 0 | 54.4 | +61.5 |
| Gaines County | 23,956 | 0 to 1.7 | 5 | 34.8 | +12.7 |
| Coryell County | 85,592 | 1.8 | 38 | 40.7 | +24.8 |
| Andrews County | 18,914 | 0 to 2.1 | 9 | 41.5 | +26.8 |
| Frio County | 18,823 | 1.6 to 2.7 | 10 | 48.6 | +44.0 |
| Karnes County | 15,018 | 0 to 2.7 | 10 | 52.6 | +55.2 |
| Hale County | 31,819 | 2.2 to 2.8 | 22 | 50.6 | +49.1 |
| Hutchinson County | 19,633 | 2 to 3.1 | 13 | 54.7 | +59.0 |
| Lamb County | 12,579 | 0 to 3.2 | 5 | 48.8 | +42.3 |
| Red River County | 11,816 | 0 to 3.4 | 6 | 63.1 | +78.2 |
| Callahan County | 14,491 | 2.1 to 3.5 | 6 | 51 | +47.2 |
| Willacy County | 19,971 | 3.5 | 7 | 45.5 | +32.2 |
| Leon County | 16,894 | 2.4 to 3.6 | 16 | 60.9 | +72.0 |
| Zapata County | 13,753 | 2.2 to 3.6 | 4 | 55.6 | +58.6 |
| Cass County | 28,651 | 3.8 | 22 | 65.1 | +78.6 |
| Deaf Smith County | 18,626 | 2.7 to 3.8 | 11 | 46 | +30.6 |
| Sabine County | 10,012 | 0 to 4 | 7 | 39.6 | +12.3 |
| Morris County | 12,133 | 2.5 to 4.1 | 13 | 61.2 | +68.1 |
| Pecos County | 14,560 | 4.1 | 16 | 64.8 | +75.5 |
| Comanche County | 14,432 | 2.8 to 4.2 | 13 | 66 | +76.5 |
| Dawson County | 11,776 | 2.5 to 4.2 | 6 | 59.6 | +63.2 |
| Duval County | 9,402 | 0 to 4.3 | 3 | 58.3 | +59.0 |
| Hill County | 39,503 | 4.3 | 42 | 65.6 | +74.5 |
| Howard County | 30,504 | 4.3 | 21 | 50.6 | +38.2 |
| Jones County | 20,861 | 3.4 to 4.3 | 10 | 46.2 | +26.3 |
| Ochiltree County | 9,284 | 0 to 4.3 | 10 | 39.9 | +10.0 |
| Stephens County | 9,380 | 0 to 4.3 | 3 | 54.5 | +48.8 |
| Caldwell County | 55,150 | 4.4 | 53 | 48.9 | +32.2 |
| Rains County | 13,542 | 3 to 4.4 | 6 | 43.3 | +17.7 |
| Zavala County | 9,037 | 0 to 4.4 | 3 | 53.2 | +43.9 |
| Jackson County | 15,393 | 3.2 to 4.5 | 19 | 48.6 | +30.5 |
| Ward County | 11,125 | 2.7 to 4.5 | 7 | 47.6 | +27.7 |
| Waller County | 69,858 | 4.6 | 81 | 41.1 | +9.6 |
| Bell County | 402,248 | 4.8 | 392 | 49.8 | +29.6 |
| Bosque County | 18,918 | 4.8 | 30 | 57.6 | +51.0 |
| Freestone County | 20,811 | 4.8 | 27 | 54.3 | +42.0 |
| Scurry County | 16,162 | 3.7 to 4.9 | 10 | 52.9 | +37.3 |
| Atascosa County | 53,590 | 5 | 53 | 52.2 | +34.4 |
| Moore County | 21,891 | 4.1 to 5 | 11 | 43.9 | +12.0 |
| Newton County | 11,954 | 3.3 to 5 | 5 | 63 | +61.6 |
| Calhoun County | 19,599 | 5.1 | 14 | 37.1 | -5.2 |
| Coleman County | 7,915 | 0 to 5.1 | 9 | 73.6 | +74.8 |
| Fannin County | 39,265 | 5.1 | 25 | 64.8 | +64.0 |
| Rusk County | 54,854 | 5.1 | 29 | 58.4 | +49.8 |
| Terry County | 11,720 | 5.1 | 7 | 56.1 | +43.6 |
| Camp County | 13,380 | 3.7 to 5.2 | 12 | 51.6 | +30.5 |
| Kleberg County | 30,315 | 5.3 | 32 | 32.7 | -15.7 |
| Winkler County | 7,540 | 0 to 5.3 | 2 | 56.8 | +42.5 |
| Upshur County | 44,410 | 5.4 | 40 | 49.8 | +22.2 |
| Yoakum County | 7,438 | 0 to 5.4 | 3 | 50.1 | +23.2 |
| Castro County | 7,295 | 0 to 5.5 | 3 | 50 | +21.2 |
| Liberty County | 121,364 | 5.5 | 78 | 54.5 | +33.8 |
| Matagorda County | 36,463 | 5.5 | 35 | 53.8 | +31.7 |
| Colorado County | 21,439 | 4.7 to 5.6 | 32 | 51.9 | +25.4 |
| Falls County | 17,869 | 4.5 to 5.6 | 20 | 61 | +49.1 |
| Orange County | 86,266 | 5.6 | 63 | 49.4 | +18.0 |
| Anderson County | 59,805 | 5.7 | 53 | 59.5 | +44.0 |
| Bailey County | 6,963 | 0 to 5.7 | 4 | 38.1 | -11.8 |
| Bastrop County | 118,908 | 5.7 | 145 | 42.4 | -1.5 |
| Wilson County | 56,139 | 5.7 | 47 | 30.9 | -24.0 |
| Hunt County | 123,336 | 5.8 | 90 | 50.3 | +18.2 |
| Palo Pinto County | 30,791 | 5.8 | 31 | 61.9 | +48.7 |
| Ector County | 173,801 | 5.9 | 146 | 49.8 | +15.3 |
| Lee County | 18,729 | 5.9 | 16 | 50.2 | +16.6 |
| Tyler County | 20,443 | 5.9 | 15 | 63.8 | +51.3 |
| Hardin County | 58,723 | 6 | 56 | 45 | +1.5 |
| Lamar County | 51,503 | 6 | 55 | 54.5 | +27.0 |
| Wise County | 83,778 | 6 | 66 | 50.4 | +15.8 |
| Brooks County | 6,579 | 0 to 6.1 | 2 | 51.1 | +17.2 |
| Guadalupe County | 201,111 | 6.1 | 202 | 33 | -26.4 |
| La Salle County | 6,517 | 0 to 6.1 | 3 | 51.2 | +17.5 |
| San Patricio County | 72,053 | 6.1 | 69 | 50.1 | +13.4 |
| Brown County | 38,711 | 6.2 | 54 | 57.6 | +32.3 |
| Parmer County | 9,678 | 6.2 | 5 | 34.3 | -25.7 |
| Runnels County | 9,693 | 4.1 to 6.2 | 6 | 65 | +49.1 |
| Wood County | 49,688 | 6.2 | 46 | 62.1 | +43.5 |
| Burleson County | 20,549 | 6.3 | 19 | 59.7 | +36.5 |
| Lampasas County | 23,657 | 6.3 | 39 | 42.8 | -8.4 |
| Titus County | 31,563 | 6.3 | 21 | 49.9 | +10.0 |
| Val Verde County | 47,835 | 6.3 | 67 | 40.2 | -15.3 |
| Cherokee County | 53,337 | 6.4 | 60 | 54.2 | +20.7 |
| DeWitt County | 20,309 | 6.4 | 21 | 60.2 | +36.9 |
| Johnson County | 218,048 | 6.4 | 215 | 40.3 | -16.1 |
| Wilbarger County | 12,481 | 4.8 to 6.4 | 10 | 70.8 | +55.2 |
| Hockley County | 21,600 | 6.5 | 20 | 45.9 | -2.4 |
| Archer County | 9,129 | 4.4 to 6.6 | 3 | 51 | +10.7 |
| Reeves County | 12,138 | 4.9 to 6.6 | 8 | 58.5 | +30.3 |
| Dallam County | 7,508 | 4 to 6.7 | 7 | 40.8 | -18.3 |
| Houston County | 22,316 | 6.7 | 21 | 64.8 | +43.0 |
| Live Oak County | 11,929 | 6.7 | 13 | 55.2 | +20.4 |
| Randall County | 152,351 | 6.8 | 191 | 40.4 | -20.6 |
| Carson County | 5,805 | 0 to 6.9 | 4 | 56.4 | +20.9 |
| Goliad County | 7,208 | 4.2 to 6.9 | 7 | 50.8 | +6.3 |
| Medina County | 56,881 | 6.9 | 53 | 40.8 | -20.7 |
| Milam County | 26,258 | 6.9 | 33 | 58.3 | +26.1 |
| Jim Wells County | 38,804 | 7 | 40 | 52.6 | +9.8 |
| San Jacinto County | 29,488 | 6.4 to 7.1 | 15 | 63.6 | n/a |
| Cooke County | 44,461 | 7.2 | 63 | 53.4 | +9.3 |
| Gray County | 20,919 | 7.2 | 16 | 50.3 | +0.8 |
| Uvalde County | 24,963 | 7.2 | 30 | 56.6 | +17.7 |
| Erath County | 43,911 | 7.3 | 61 | 47.6 | -7.3 |
| Franklin County | 10,994 | 7.3 | 10 | 61.7 | +30.2 |
| Jasper County | 33,075 | 7.3 | 30 | 56.5 | +16.7 |
| Montague County | 21,966 | 7.3 | 25 | 62.2 | +31.3 |
| Navarro County | 57,181 | 7.3 | 59 | 56.6 | +16.9 |
| Gonzales County | 20,159 | 7.4 | 23 | 59.1 | +22.7 |
| Shelby County | 24,286 | 7.4 | 23 | 59.9 | +24.7 |
| Dimmit County | 8,024 | 5 to 7.5 | 12 | 60.8 | n/a |
| Refugio County | 6,657 | 4.5 to 7.5 | 9 | 66 | n/a |
| Swisher County | 6,703 | 4.5 to 7.5 | 5 | 61.1 | n/a |
| Martin County | 5,284 | 0 to 7.6 | 2 | 36 | n/a |
| Robertson County | 17,839 | 6.7 to 7.8 | 21 | 53 | n/a |
| Wharton County | 42,060 | 7.8 | 53 | 47.1 | -13.9 |
| Brazos County | 249,088 | 7.9 | 477 | 35.6 | -42.2 |
| Bee County | 32,515 | 8 | 21 | 49.9 | -8.4 |
| Kaufman County | 209,235 | 8 | 193 | 42.8 | -26.8 |
| McCulloch County | 7,472 | 8 | 6 | 64 | +27.7 |
| Angelina County | 88,154 | 8.1 | 128 | 58.4 | +14.2 |
| Hamilton County | 8,680 | 8.1 | 19 | 72.1 | +38.4 |
| Henderson County | 88,595 | 8.1 | 126 | 61.5 | +21.7 |
| Crosby County | 4,852 | 0 to 8.2 | 3 | 54.1 | n/a |
| Floyd County | 4,881 | 0 to 8.2 | 5 | 58.1 | n/a |
| Grimes County | 34,252 | 8.2 | 36 | 50.8 | -6.8 |
| El Paso County | 877,858 | 8.3 | 1,278 | 54.9 | +2.8 |
| Panola County | 23,018 | 8.3 | 20 | 56.3 | +6.5 |
| Clay County | 10,764 | 6.5 to 8.4 | 8 | 52.3 | n/a |
| Jack County | 9,563 | 6.3 to 8.4 | 10 | 56 | n/a |
| Madison County | 14,226 | 8.4 | 17 | 54.4 | +0.6 |
| Starr County | 66,319 | 8.4 | 46 | 43.5 | -28.4 |
| Williamson County | 752,827 | 8.4 | 1,547 | 28 | -57.4 |
| Chambers County | 57,594 | 8.5 | 52 | 40.9 | -36.0 |
| Ellis County | 240,867 | 8.5 | 334 | 41.2 | -35.2 |
| Webb County | 281,224 | 8.5 | 361 | 38.6 | -41.4 |
| San Saba County | 5,787 | 5.2 to 8.6 | 10 | 55.4 | n/a |
| Denton County | 1,069,346 | 8.7 | 2,041 | 31.6 | -55.4 |
| Mills County | 4,580 | 0 to 8.7 | 7 | 37.7 | n/a |
| Crane County | 4,554 | 0 to 8.8 | 4 | 42.8 | n/a |
| Limestone County | 22,849 | 8.8 | 28 | 60.7 | +14.0 |
| Mitchell County | 8,947 | 8.9 | 5 | 45.6 | -26.5 |
| Taylor County | 150,077 | 8.9 | 279 | 44.1 | -31.0 |
| Tom Green County | 120,602 | 8.9 | 218 | 46.2 | -25.3 |
| Washington County | 38,288 | 8.9 | 100 | 57.5 | +5.1 |
| Maverick County | 58,823 | 9 | 56 | 45.4 | -27.5 |
| Trinity County | 14,384 | 7.6 to 9 | 12 | 75.3 | +33.2 |
| Haskell County | 5,499 | 5.5 to 9.1 | 7 | 50.9 | n/a |
| Nacogdoches County | 66,035 | 9.1 | 106 | 51.1 | -12.5 |
| San Augustine County | 7,722 | 6.5 to 9.1 | 6 | 84.6 | n/a |
| Van Zandt County | 66,130 | 9.1 | 57 | 52.4 | -9.6 |
| Nolan County | 14,117 | 9.2 | 17 | 69.6 | +27.4 |
| Victoria County | 92,656 | 9.2 | 161 | 46.2 | -27.4 |
| Midland County | 187,855 | 9.3 | 454 | 37.8 | -48.9 |
| Wichita County | 129,555 | 9.3 | 194 | 55.9 | -1.7 |
| Harrison County | 71,956 | 9.7 | 75 | 53.8 | -10.1 |
| Somervell County | 10,261 | 7.8 to 9.7 | 12 | 47.9 | -26.1 |
| Hays County | 304,390 | 9.9 | 843 | 33 | -61.0 |
| Hidalgo County | 921,549 | 9.9 | 1,145 | 40.2 | -47.2 |
| Parker County | 184,767 | 9.9 | 282 | 38.6 | -50.7 |
| Young County | 18,154 | 9.9 | 23 | 54 | -10.7 |
| Cameron County | 433,946 | 10.1 | 600 | 43.1 | -40.5 |
| Hansford County | 4,944 | 6.1 to 10.1 | 4 | 36.1 | n/a |
| Marion County | 9,896 | 8.1 to 10.1 | 10 | 76.3 | +26.7 |
| McLennan County | 272,020 | 10.1 | 717 | 42.6 | -42.2 |
| Hood County | 70,501 | 10.2 | 131 | 49.3 | -25.2 |
| Austin County | 33,625 | 10.4 | 58 | 49.1 | -26.8 |
| Childress County | 6,643 | 10.5 | 8 | 52.1 | -18.8 |
| Eastland County | 18,143 | 10.5 | 38 | 67.7 | +16.9 |
| Wheeler County | 4,773 | 6.3 to 10.5 | 4 | 63.8 | n/a |
| Lavaca County | 20,651 | 10.7 | 26 | 45.4 | -37.6 |
| Polk County | 53,434 | 10.7 | 64 | 66.3 | +13.8 |
| Bowie County | 92,696 | 10.8 | 190 | 58.1 | -4.2 |
| Grayson County | 153,613 | 10.8 | 240 | 53.5 | -16.6 |
| Brazoria County | 419,080 | 11 | 891 | 30.8 | -69.8 |
| Hopkins County | 39,063 | 11 | 46 | 50.7 | -24.9 |
| Jim Hogg County | 4,555 | 6.6 to 11 | 3 | 39.5 | n/a |
| Concho County | 3,607 | 0 to 11.1 | 3 | 63 | n/a |
| Llano County | 23,353 | 11.1 | 97 | 65.2 | +10.0 |
| Comal County | 209,166 | 11.2 | 551 | 35.6 | -63.2 |
| Tarrant County | 2,248,466 | 11.3 | 5,986 | 42.4 | -48.3 |
| Bandera County | 22,876 | 11.4 | 43 | 70.4 | +16.9 |
| Lubbock County | 328,906 | 11.4 | 854 | 45.1 | -41.5 |
| Aransas County | 26,146 | 10.7 to 11.5 | 58 | 62.4 | +3.4 |
| Baylor County | 3,472 | 0 to 11.5 | 5 | 75.8 | n/a |
| Lynn County | 6,017 | 8.3 to 11.6 | 6 | 39.4 | -56.9 |
| Coke County | 3,412 | 0 to 11.7 | 1 | 65.8 | n/a |
| Hudspeth County | 3,433 | 0 to 11.7 | 2 | 50.1 | n/a |
| Kerr County | 54,037 | 11.7 | 141 | 58 | -7.9 |
| Fort Bend County | 975,191 | 11.8 | 2,454 | 26.8 | -76.7 |
| Montgomery County | 781,194 | 12 | 1,963 | 32.1 | -71.9 |
| Galveston County | 372,207 | 12.1 | 892 | 41.4 | -53.7 |
| Jefferson County | 254,321 | 12.1 | 577 | 56.6 | -13.6 |
| Hardeman County | 3,292 | 0 to 12.2 | 3 | 67.5 | n/a |
| Knox County | 3,192 | 0 to 12.5 | 2 | 50.1 | n/a |
| Sutton County | 3,203 | 0 to 12.5 | 8 | 31 | n/a |
| Collin County | 1,297,179 | 12.8 | 4,289 | 30.5 | -76.2 |
| Kinney County | 3,128 | 0 to 12.8 | 3 | 51.8 | n/a |
| Upton County | 3,131 | 0 to 12.8 | 2 | 65 | n/a |
| Rockwall County | 140,738 | 12.9 | 436 | 29.8 | -77.5 |
| Bexar County | 2,160,088 | 13 | 6,704 | 47.1 | -41.5 |
| Lipscomb County | 2,955 | 0 to 13.5 | 1 | 46.5 | n/a |
| Potter County | 114,453 | 13.7 | 385 | 61.5 | -4.7 |
| Burnet County | 57,015 | 13.9 | 117 | 49.4 | -37.3 |
| Fayette County | 25,459 | 14.1 | 56 | 50.7 | -33.7 |
| Nueces County | 352,992 | 14.1 | 875 | 48.6 | -39.7 |
| Crockett County | 2,769 | 0 to 14.4 | 5 | 44.2 | n/a |
| Smith County | 252,549 | 14.5 | 690 | 53.5 | -27.1 |
| Real County | 2,745 | 0 to 14.6 | 4 | 72.5 | n/a |
| Brewster County | 9,458 | 14.8 | 33 | 52.2 | -31.3 |
| Shackelford County | 3,197 | 9.4 to 15.6 | 6 | 40.2 | n/a |
| Cochran County | 2,546 | 0 to 15.7 | 3 | 60 | n/a |
| Walker County | 83,842 | 15.7 | 98 | 55.7 | -23.4 |
| Gregg County | 126,095 | 15.8 | 278 | 56.9 | -21.0 |
| Reagan County | 3,166 | 9.5 to 15.8 | 3 | 36.6 | n/a |
| Collingsworth County | 2,487 | 0 to 16.1 | 4 | 69.2 | n/a |
| Blanco County | 13,581 | 16.2 | 45 | 52.8 | -32.0 |
| Delta County | 5,549 | 12.6 to 16.2 | 7 | 41.6 | n/a |
| Hemphill County | 3,083 | 9.7 to 16.2 | 5 | 32.5 | n/a |
| Presidio County | 5,433 | 12.9 to 16.6 | 14 | 59.6 | n/a |
| Harris County | 5,045,026 | 17.4 | 25,911 | 44.4 | -56.7 |
| Garza County | 4,510 | 13.3 to 17.7 | 5 | 44.7 | -56.3 |
| Schleicher County | 2,245 | 0 to 17.8 | 4 | 48.1 | n/a |
| Donley County | 3,213 | 18.7 | 6 | 52.8 | -35.5 |
| Dallas County | 2,661,397 | 19.1 | 17,719 | 46.6 | -52.8 |
| Menard County | 1,956 | 0 to 20.4 | 2 | 74.3 | n/a |
| Kendall County | 53,289 | 21.4 | 259 | 39.9 | -71.5 |
| Armstrong County | 1,843 | 0 to 21.7 | 2 | 44.1 | n/a |
| Travis County | 1,389,670 | 22.3 | 11,667 | 32.7 | -85.8 |
| Gillespie County | 28,527 | 22.8 | 118 | 45.2 | -58.5 |
| Dickens County | 1,692 | 0 to 23.6 | 3 | 70.6 | n/a |
| Throckmorton County | 1,554 | 0 to 25.7 | 1 | 82.6 | n/a |
| Kimble County | 4,438 | 22.5 to 27 | 8 | 62.6 | -14.6 |
| Briscoe County | 1,474 | 0 to 27.1 | 1 | 44.1 | n/a |
| Irion County | 1,463 | 0 to 27.3 | 2 | 29 | n/a |
| Edwards County | 1,370 | 0 to 29.2 | 3 | 67.2 | n/a |
| Sterling County | 1,349 | 0 to 29.7 | 1 | 44.9 | n/a |
| Mason County | 3,990 | 25.1 to 30.1 | 15 | 55.5 | -32.8 |
| Cottle County | 1,224 | 0 to 32.7 | 1 | 60.1 | n/a |
| Stonewall County | 1,186 | 0 to 33.7 | 1 | 57.4 | n/a |
| Jeff Davis County | 1,711 | 23.4 to 35.1 | 6 | 82.5 | +1.6 |
| Foard County | 1,044 | 0 to 38.3 | 1 | 28.1 | n/a |
| Motley County | 1,043 | 0 to 38.4 | 1 | 54.1 | n/a |
| Roberts County | 867 | 0 to 46.1 | 1 | 10.1 | n/a |
| Terrell County | 702 | 0 to 57 | 2 | 35.8 | n/a |
| Borden County | 567 | 0 to 70.5 | 1 | 27.9 | n/a |
| McMullen County | 544 | 0 to 73.5 | 1 | 51.3 | n/a |
| Kenedy County | 319 | 0 to 125.4 | 1 | 77.4 | n/a |
| Loving County | 52 | 0 to 769.2 | 2 | 63.3 | n/a |
No match for that name.
The colored mark shows each county's class on the map. A range such as "2.2 to 2.8" for Hale County means Census withholds a count under 3, so the rate is shown at both ends. Licensed attorneys: Attorney Population Density by MSA 2025-26, State Bar of Texas: active in-state attorneys by county, December 31, 2025.
Share of residents living in a county with fewer than 7 legal practices per 10,000 or no licensed attorneys. Texas ranks 38th of 50 states and D.C., where 1st has the largest share.
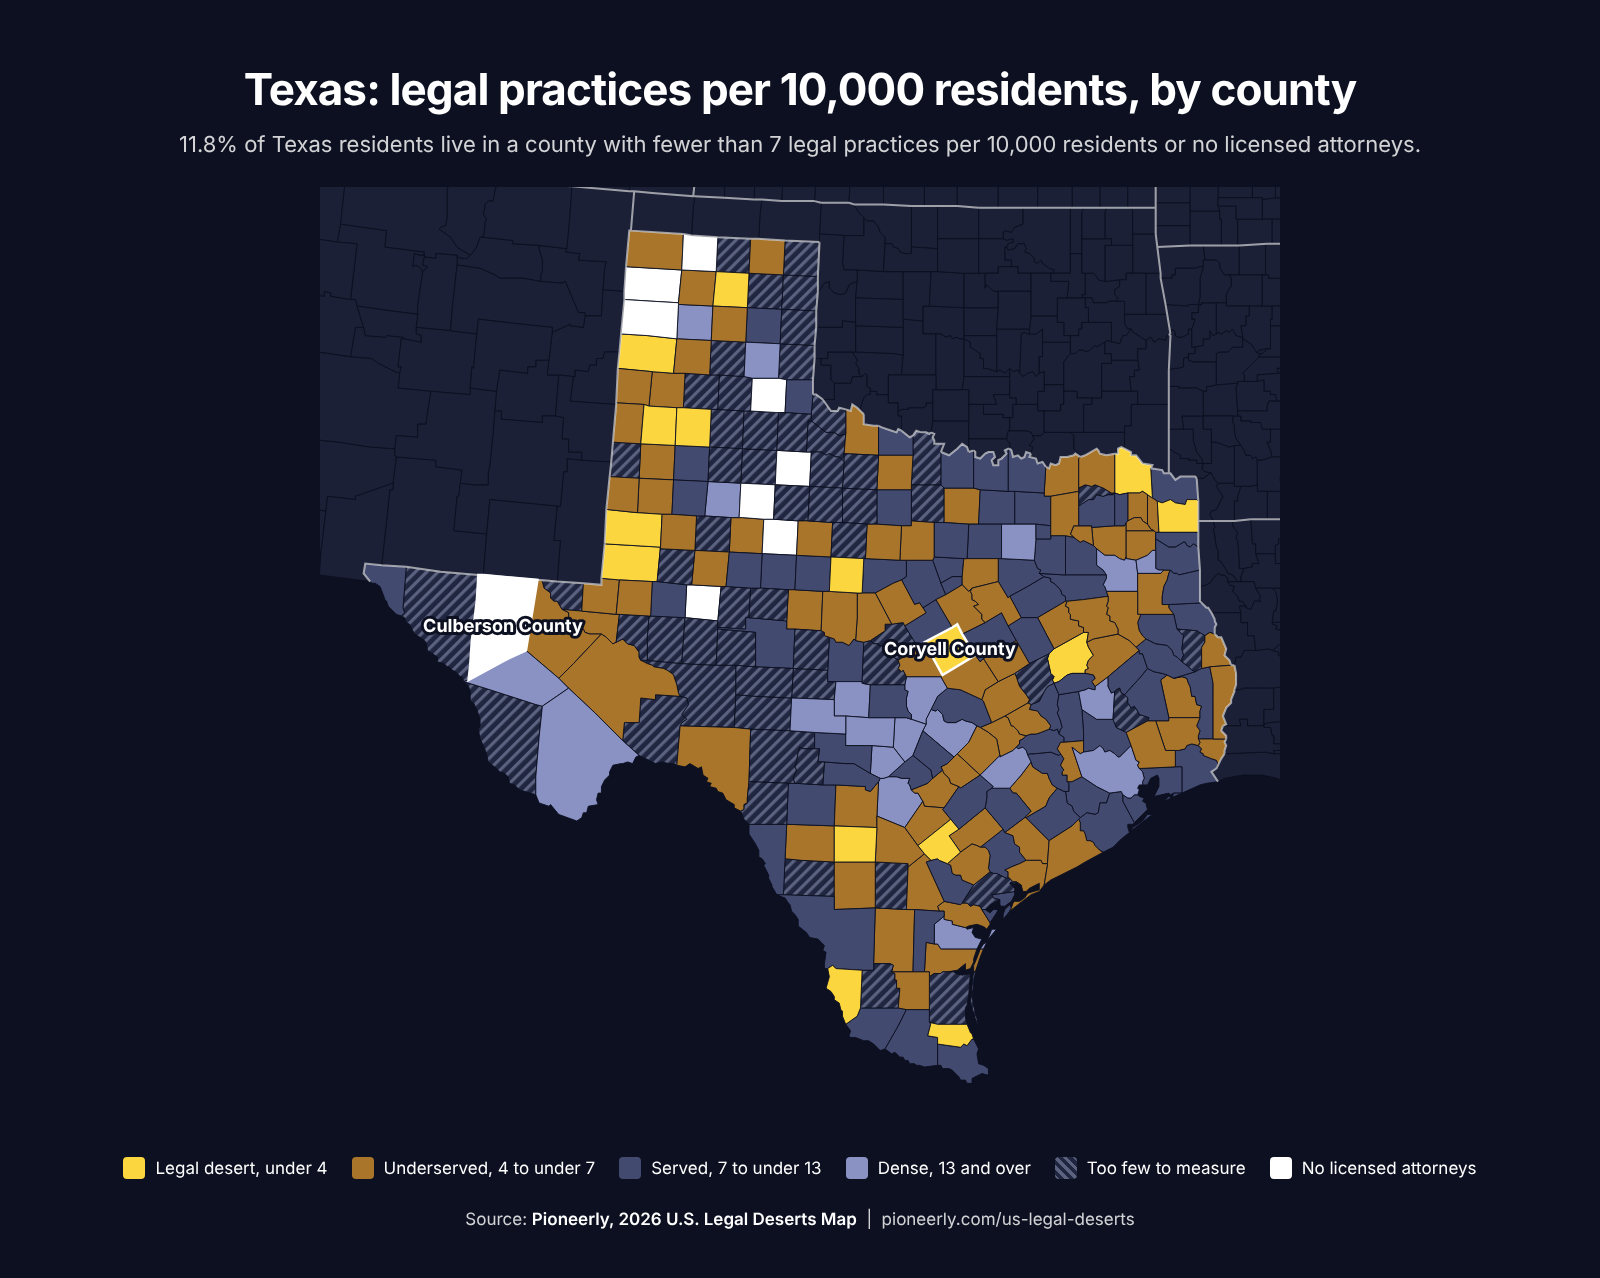
The statewide share is low because most Texans live in large metro counties. Still, 103 of the 254 counties in Texas, home to 3,757,203 people, have fewer than 7 legal practices per 10,000 residents or no licensed attorneys.
Texas has 99,867 active lawyers, according to the American Bar Association's 2025 count. That's 31.5 per 10,000 residents, compared with 39.8 across the U.S. The State Bar of Texas counted 101,162 active in-state attorneys as of December 31, 2025. The U.S. Census Bureau counts 13,833 law offices with paid staff and 25,610 solo practices in Texas.
Nine. The State Bar of Texas count of active in-state attorneys lists none in Culberson, Fisher, Glasscock, Hall, Hartley, Kent, King, Oldham, and Sherman counties as of December 31, 2025. About 20,000 people live in them.
A legal desert is a county with fewer than 4 legal practices per 10,000 residents, counting law offices with paid staff and solo practices. Texas has 15 legal deserts, home to 350,536 people, and Coryell County is the largest, with 85,592 residents.
King County, which has no licensed attorneys, is about 63 miles in a straight line from Childress County, the nearest county with 7 or more legal practices per 10,000 residents.
61% of licensed attorneys in Texas work in Harris, Dallas, Travis, and Bexar counties, which are home to 35% of Texans. 69 Texas counties have 5 or fewer licensed attorneys.
11.8% of Texans live in a county with fewer than 7 legal practices per 10,000 residents or no licensed attorneys, compared with 20.9% of all Americans. Texas ranks 38th of 50 states and D.C., where 1st has the largest share.
The population of Texas grew 8.5% from July 2020 to July 2025, and its law offices with paid staff grew 2.8% from 2018 to 2023. 117 Texas counties gained residents, and 57 of them had fewer law offices in 2023 than in 2018.
The CSV covers all 3,144 U.S. counties, including every Texas county. It's free to use with a link back to this page (CC BY 4.0).
Download the CSVPioneerly, Legal Deserts in Texas: Where Lawyers Are Scarce, pioneerly.com/us-legal-deserts/texas/. Journalists, researchers, and bar associations are welcome to use the figures and maps with this credit.
We help midsize law firms choose where to expand, reach local clients, and turn inquiries into signed cases and matters.