Garfield County
1,710 residents
Need for legal services 26.9 (lowest)




Data last updated
Hover over a county for a quick summary, or click or tap it for details. Switch views to compare legal practices, the need for legal help, and the gap between them.
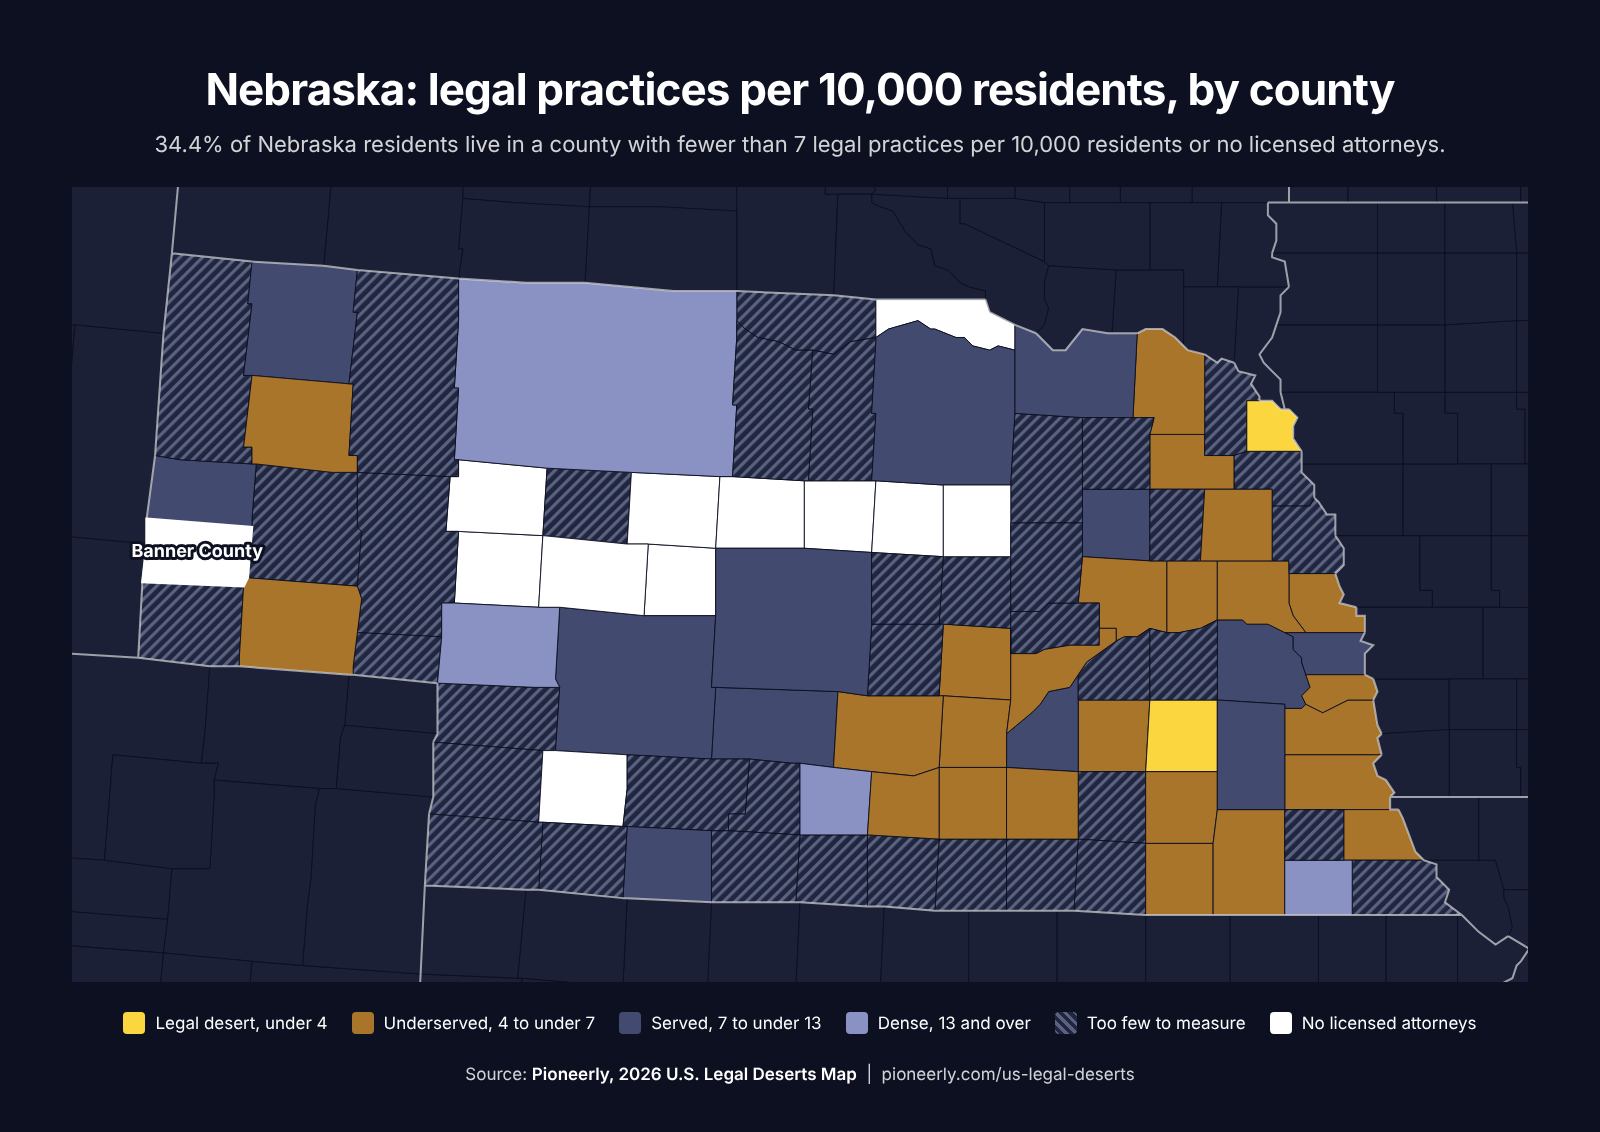
The Nebraska State Bar Association map of April 2025 shows no lawyers with active licenses in these counties.
1,710 residents
Need for legal services 26.9 (lowest)
1,674 residents
Need for legal services 41.7 (low)
821 residents
Need for legal services 33.2 (lowest)
789 residents
Need for legal services 41.4 (low)
686 residents
Need for legal services 63.2 (highest)
669 residents
Need for legal services 17.8 (lowest)
639 residents
Need for legal services 46 (low)
570 residents
Need for legal services 40.5 (low)
561 residents
Need for legal services 44 (low)
458 residents
Need for legal services 20.9 (lowest)
396 residents
Need for legal services 39.7 (low)
369 residents
Need for legal services 23.9 (lowest)
Douglas, Lancaster, Sarpy, and Buffalo counties are home to 59% of Nebraskans.
Nebraska counties with fewer than 7 legal practices per 10,000 residents, by population, including all 2 legal deserts. Click a county to see it on the map.
| County | Residents | Law offices with staff | Solo practices | Practices per 10,000 |
|---|---|---|---|---|
| Sarpy County | 208,303 | 24 | 68 | 4.4 |
| Hall County | 63,633 | 25 | 14 | 6.1 |
| Buffalo County | 51,172 | 20 | 8 | 5.5 |
| Dodge County | 38,057 | 11 | 9 | 5.3 |
| Platte County | 35,649 | 14 | 7 | 5.9 |
| Adams County | 31,071 | 12 | 7 | 6.1 |
| Cass County | 27,657 | 5 | 12 | 6.1 |
| Gage County | 21,711 | 8 | 7 | 6.9 |
| Dakota County | 21,687 | 4 | 4 | 3.7 |
| Washington County | 21,302 | 4 | 6 | 4.7 |
| Seward County | 18,032 | 3 | 4 | 3.9 |
| Otoe County | 16,531 | under 3 | 9 | 6.7 |
| Saline County | 14,996 | 5 | 4 | 6 |
| York County | 14,564 | 5 | 3 | 5.5 |
| Colfax County | 10,934 | under 3 | 3 | 4.6 |
Highest gap scores among Nebraska counties with 10,000 or more residents
The colored mark shows each county's class on the map. "Under 3" means the unpublished Census count is 0, 1, or 2. Box Butte County's gap score of +38 means it ranks much higher for legal need than for legal practices per resident.
Looking to expand your law firm in Nebraska? Pioneerly helps you develop a growth strategy and build a complete case acquisition system focused on the cases your firm wants more of.
5,959* active lawyers live in Nebraska.
That's 29.5 per 10,000 residents, compared with 39.8 across the U.S. The count rose 7.4% over five years.
Source: American Bar Association, National Lawyer Population Survey 2025.
5,192* licensed attorneys are based in Nebraska, according to the Nebraska State Bar Association.
Source: Nebraska State Bar Association, lawyers with active licenses, April 2025.
817 law offices with paid staff operate in Nebraska.
916 solo practices operate in Nebraska.
These are legal services businesses with no paid employees.
*The American Bar Association and the Nebraska State Bar Association count lawyers in different ways.
Straight-line distance from the center of each legal desert and county with no licensed attorneys to the center of the nearest county with 7 or more legal practices per 10,000 residents, including neighboring states.
| County | Residents | Nearest county with 7 or more | Miles |
|---|---|---|---|
| Thomas County | 639 | Cherry County | 52 |
| Grant County | 561 | Keith County | 50 |
| McPherson County | 369 | Lincoln County | 40 |
| Wheeler County | 789 | Holt County | 40 |
| Garfield County | 1,710 | Holt County | 39 |
| Hayes County | 821 | Red Willow County | 39 |
| Loup County | 570 | Custer County | 39 |
| Blaine County | 458 | Custer County | 38 |
| Logan County | 669 | Lincoln County | 38 |
| Boyd County | 1,674 | Holt County | 31 |
| Dakota County | 21,687 | Woodbury County, Iowa | 27 |
| Arthur County | 396 | Keith County | 26 |
| Seward County | 18,032 | Lancaster County | 24 |
| Banner County | 686 | Scotts Bluff County | 21 |
The six measures that make up the need for legal services, each tied to a practice area, with the county where it's highest among those with 10,000 or more residents.
Highest: Box Butte County, 33.4
Highest: Holt County, 22.9%
Highest: Lincoln County, 16.1%
Highest: Hall County, 14.1%
Highest: Gage County, 29.0
Highest: Colfax County, 28.9%
State and U.S. figures are county figures weighted by population. Fatal crashes are the yearly average for 2023 and 2024, and bankruptcy filings are for 2025.
These counties gained residents from 2020 to 2025 and had fewer law offices with paid staff in 2023 than in 2018. The 8 fastest-growing are shown.
| County | Residents | Change since 2020 | Law offices, 2018 | Law offices, 2023 |
|---|---|---|---|---|
| Cass County | 27,657 | +3.9% | 6 | 5 |
| Douglas County | 606,460 | +3.6% | 337 | 334 |
| Lancaster County | 334,049 | +3.4% | 145 | 130 |
| Hamilton County | 9,678 | +2.9% | 4 | 3 |
| Seward County | 18,032 | +2.3% | 5 | 3 |
| Buffalo County | 51,172 | +1.9% | 25 | 20 |
| Cherry County | 5,561 | +1.9% | 5 | 4 |
| Washington County | 21,302 | +1.8% | 7 | 4 |
Population change is July 2020 to July 2025, from the Census Population Estimates. Law offices with paid staff are from Census County Business Patterns, which publishes counts of 3 or more. The statewide office change covers the 36 counties with both counts published.
We can rank all 93 Nebraska counties by population growth, legal need, and the legal practices already there, for the practice areas your firm wants more of.
Contact usSort by any column, or type a name to filter. Click a county to see it on the map.
| How much people in the county are likely to need a lawyer, from 0 (least in the U.S.) to 100 (most). | How far the need for legal help runs ahead of local legal practices. Above 0 means more need than practices. | ||||
|---|---|---|---|---|---|
| Arthur County | 396 | No licensed attorneys | 0 | 39.7 | +22.6 |
| Banner County | 686 | No licensed attorneys | 0 | 63.2 | +83.5 |
| Blaine County | 458 | No licensed attorneys | 0 | 20.9 | +0.7 |
| Boyd County | 1,674 | No licensed attorneys | 0 | 41.7 | +28.0 |
| Garfield County | 1,710 | No licensed attorneys | 0 | 26.9 | +2.9 |
| Grant County | 561 | No licensed attorneys | 0 | 44 | +33.5 |
| Hayes County | 821 | No licensed attorneys | 0 | 33.2 | +10.2 |
| Logan County | 669 | No licensed attorneys | 0 | 17.8 | +0.3 |
| Loup County | 570 | No licensed attorneys | 0 | 40.5 | +24.5 |
| McPherson County | 369 | No licensed attorneys | 0 | 23.9 | +1.6 |
| Thomas County | 639 | No licensed attorneys | 0 | 46 | +39.0 |
| Wheeler County | 789 | No licensed attorneys | 0 | 41.4 | +27.1 |
| Dakota County | 21,687 | 3.7 | 15 | 41.1 | +18.7 |
| Seward County | 18,032 | 3.9 | 22 | 20.2 | -8.9 |
| Sarpy County | 208,303 | 4.4 | 360 | 29.2 | -9.4 |
| Colfax County | 10,934 | 2.7 to 4.6 | 3 | 37.5 | +1.5 |
| Washington County | 21,302 | 4.7 | 28 | 33.2 | -7.7 |
| Box Butte County | 10,494 | 2.9 to 4.8 | 4 | 52.6 | +37.9 |
| Cedar County | 8,373 | 0 to 4.8 | 6 | 24.3 | -17.2 |
| Wayne County | 10,020 | 3 to 5 | 5 | 36.1 | -6.0 |
| Merrick County | 7,905 | 0 to 5.1 | 6 | 50.4 | +28.1 |
| Cheyenne County | 9,528 | 3.1 to 5.2 | 9 | 56.9 | +43.9 |
| Dodge County | 38,057 | 5.3 | 40 | 50.4 | +25.6 |
| Buffalo County | 51,172 | 5.5 | 94 | 37.3 | -10.4 |
| York County | 14,564 | 5.5 | 19 | 40.3 | -4.1 |
| Nemaha County | 7,102 | 0 to 5.6 | 6 | 45 | +6.7 |
| Jefferson County | 7,070 | 0 to 5.7 | 3 | 58.4 | +41.4 |
| Kearney County | 6,790 | 0 to 5.9 | 4 | 40.5 | -8.9 |
| Platte County | 35,649 | 5.9 | 37 | 41.2 | -7.0 |
| Saline County | 14,996 | 6 | 14 | 30 | -29.2 |
| Adams County | 31,071 | 6.1 | 40 | 47.2 | +5.6 |
| Cass County | 27,657 | 6.1 | 36 | 31.2 | -29.0 |
| Hall County | 63,633 | 6.1 | 78 | 45.2 | +0.8 |
| Howard County | 6,538 | 0 to 6.1 | 4 | 36 | -21.1 |
| Clay County | 6,170 | 0 to 6.5 | 4 | 35.6 | -26.9 |
| Otoe County | 16,531 | 5.4 to 6.7 | 19 | 47.8 | -0.1 |
| Cuming County | 8,823 | 4.5 to 6.8 | 7 | 43.5 | -12.4 |
| Gage County | 21,711 | 6.9 | 25 | 48.7 | +0.0 |
| Holt County | 10,067 | 7 | 8 | 36.6 | -30.8 |
| Stanton County | 5,744 | 0 to 7 | 4 | 29.8 | n/a |
| Butler County | 8,507 | 4.7 to 7.1 | 5 | 45.2 | n/a |
| Dixon County | 5,602 | 0 to 7.1 | 3 | 49.3 | n/a |
| Madison County | 36,106 | 7.2 | 58 | 47 | -8.2 |
| Fillmore County | 5,458 | 0 to 7.3 | 6 | 47.3 | n/a |
| Thurston County | 6,752 | 4.4 to 7.4 | 6 | 36.4 | n/a |
| Burt County | 6,678 | 4.5 to 7.5 | 3 | 55.2 | n/a |
| Dawes County | 7,858 | 7.6 | 9 | 21.7 | -52.8 |
| Polk County | 5,270 | 0 to 7.6 | 1 | 42.7 | n/a |
| Johnson County | 5,218 | 0 to 7.7 | 8 | 57.2 | n/a |
| Red Willow County | 10,307 | 7.8 | 11 | 45.7 | -17.1 |
| Antelope County | 6,352 | 4.7 to 7.9 | 4 | 43.3 | n/a |
| Pierce County | 7,378 | 5.4 to 8.1 | 4 | 35.6 | n/a |
| Sheridan County | 4,809 | 0 to 8.3 | 2 | 38.5 | n/a |
| Knox County | 8,335 | 8.4 | 6 | 40.3 | -36.9 |
| Scotts Bluff County | 35,586 | 8.7 | 56 | 53.3 | -4.7 |
| Saunders County | 23,702 | 8.9 | 48 | 32.2 | -56.1 |
| Lancaster County | 334,049 | 9.1 | 1,197 | 36 | -50.8 |
| Morrill County | 4,404 | 0 to 9.1 | 4 | 49.7 | n/a |
| Boone County | 5,355 | 5.6 to 9.3 | 5 | 44.8 | n/a |
| Hamilton County | 9,678 | 9.3 | 20 | 33.1 | -57.5 |
| Richardson County | 7,530 | 6.6 to 9.3 | 7 | 45.8 | n/a |
| Custer County | 10,500 | 9.5 | 16 | 43.4 | -36.5 |
| Nuckolls County | 4,100 | 0 to 9.8 | 1 | 30.1 | n/a |
| Lincoln County | 33,303 | 10.2 | 50 | 60 | +3.7 |
| Thayer County | 4,842 | 6.2 to 10.3 | 4 | 35.4 | n/a |
| Chase County | 3,718 | 0 to 10.8 | 4 | 44.8 | n/a |
| Furnas County | 4,524 | 6.6 to 11.1 | 5 | 51.9 | n/a |
| Kimball County | 3,391 | 0 to 11.8 | 1 | 62.8 | n/a |
| Webster County | 3,336 | 0 to 12 | 3 | 43.6 | n/a |
| Douglas County | 606,460 | 12.4 | 2,609 | 40 | -58.2 |
| Dawson County | 24,452 | 12.7 | 32 | 36 | -67.1 |
| Harlan County | 3,000 | 0 to 13.3 | 5 | 37.2 | n/a |
| Sherman County | 2,924 | 0 to 13.7 | 4 | 48.8 | n/a |
| Perkins County | 2,849 | 0 to 14 | 2 | 30.3 | n/a |
| Franklin County | 2,795 | 0 to 14.3 | 2 | 30.8 | n/a |
| Phelps County | 8,994 | 14.5 | 15 | 39.5 | -64.2 |
| Valley County | 4,094 | 9.8 to 14.7 | 10 | 35.6 | n/a |
| Frontier County | 2,655 | 0 to 15.1 | 2 | 49.9 | n/a |
| Nance County | 3,290 | 9.1 to 15.2 | 3 | 54.3 | n/a |
| Hitchcock County | 2,467 | 0 to 16.2 | 2 | 62.8 | n/a |
| Brown County | 2,826 | 10.6 to 17.7 | 4 | 42.5 | n/a |
| Cherry County | 5,561 | 18 | 11 | 38.4 | -72.2 |
| Keith County | 8,100 | 18.5 | 22 | 61 | -13.9 |
| Greeley County | 2,154 | 0 to 18.6 | 1 | 31.2 | n/a |
| Deuel County | 1,862 | 0 to 21.5 | 1 | 55.3 | n/a |
| Garden County | 1,804 | 0 to 22.2 | 2 | 41.3 | n/a |
| Gosper County | 1,803 | 0 to 22.2 | 3 | 42 | n/a |
| Pawnee County | 2,510 | 15.9 to 23.9 | 4 | 60.5 | -18.5 |
| Dundy County | 1,568 | 0 to 25.5 | 3 | 54.1 | n/a |
| Rock County | 1,259 | 0 to 31.8 | 2 | 24 | n/a |
| Sioux County | 1,188 | 0 to 33.7 | 4 | 44.5 | n/a |
| Keya Paha County | 792 | 0 to 50.5 | 1 | 26.4 | n/a |
| Hooker County | 686 | 0 to 58.3 | 1 | 12.4 | n/a |
No match for that name.
The colored mark shows each county's class on the map. A range such as "5.4 to 6.7" for Otoe County means Census withholds a count under 3, so the rate is shown at both ends. Licensed attorneys: Active lawyers by county, April 2025, Nebraska State Bar Association: lawyers with active licenses, judges not included.
Share of residents living in a county with fewer than 7 legal practices per 10,000 or no licensed attorneys. Nebraska ranks 13th of 50 states and D.C., where 1st has the largest share.
38 of the 93 counties in Nebraska, home to 693,454 people, have fewer than 7 legal practices per 10,000 residents or no licensed attorneys.
Nebraska has 5,959 active lawyers, according to the American Bar Association's 2025 count. That's 29.5 per 10,000 residents, compared with 39.8 across the U.S. The Nebraska State Bar Association counted 5,192 lawyers with active licenses as of April 2025. The U.S. Census Bureau counts 817 law offices with paid staff and 916 solo practices in Nebraska.
Twelve. The Nebraska State Bar Association map of April 2025 shows no lawyers with active licenses in Arthur, Banner, Blaine, Boyd, Garfield, Grant, Hayes, Logan, Loup, McPherson, Thomas, and Wheeler counties. About 9,300 people live in them.
A legal desert is a county with fewer than 4 legal practices per 10,000 residents, counting law offices with paid staff and solo practices. Nebraska has 2 legal deserts, home to 39,719 people, and Dakota County is the largest, with 21,687 residents.
Thomas County, which has no licensed attorneys, is about 52 miles in a straight line from Cherry County, the nearest county with 7 or more legal practices per 10,000 residents.
82% of licensed attorneys in Nebraska work in Douglas, Lancaster, Sarpy, and Buffalo counties, which are home to 59% of Nebraskans. 53 Nebraska counties have 5 or fewer licensed attorneys.
34.4% of Nebraskans live in a county with fewer than 7 legal practices per 10,000 residents or no licensed attorneys, compared with 20.9% of all Americans. Nebraska ranks 13th of 50 states and D.C., where 1st has the largest share.
The population of Nebraska grew 2.8% from July 2020 to July 2025, and its law offices with paid staff fell 5.3% from 2018 to 2023. 23 Nebraska counties gained residents, and 12 of them had fewer law offices in 2023 than in 2018.
The CSV covers all 3,144 U.S. counties, including every Nebraska county. It's free to use with a link back to this page (CC BY 4.0).
Download the CSVPioneerly, Legal Deserts in Nebraska: Where Lawyers Are Scarce, pioneerly.com/us-legal-deserts/nebraska/. Journalists, researchers, and bar associations are welcome to use the figures and maps with this credit.
We help midsize law firms choose where to expand, reach local clients, and turn inquiries into signed cases and matters.