
Legal Deserts in Minnesota: Where Lawyers Are Scarce


Data last updated
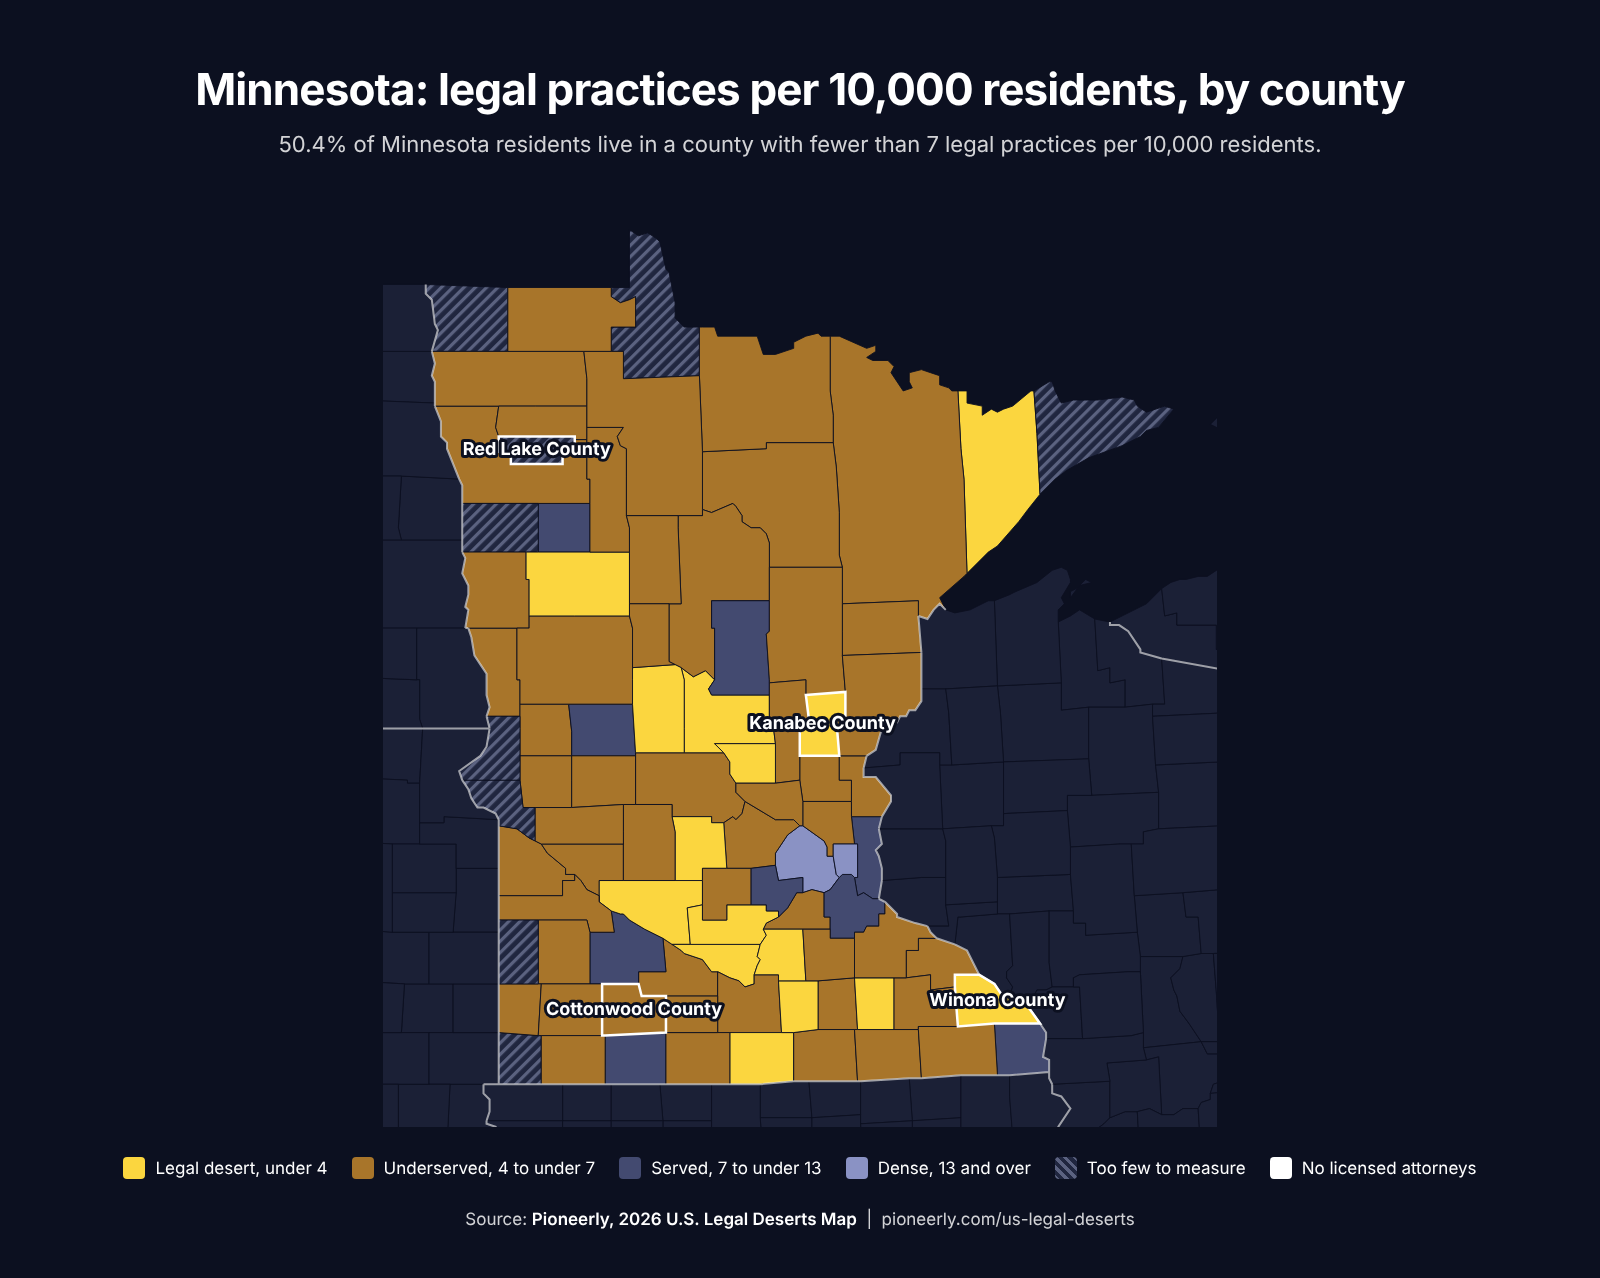
Legal practices per 10,000 residents in every Minnesota county
Hover over a county for a quick summary, or click or tap it for details. Switch views to compare legal practices, the need for legal help, and the gap between them.
Download the Minnesota maps
Four counties hold at least 69% of the legal practices in Minnesota
Hennepin, Ramsey, Dakota, and Washington counties are home to 44% of Minnesotans.
Census withholds counts under 3, so the state total of legal practices is a range. The share shown is the lowest it can be.
The largest legal deserts in Minnesota
All 15 Minnesota counties with fewer than 4 legal practices per 10,000 residents, by population. Click a county to see it on the map.
| County | Residents | Law offices with staff | Solo practices | Practices per 10,000 |
|---|---|---|---|---|
| Winona County | 50,523 | 10 | 8 | 3.6 |
| Benton County | 41,744 | 4 | 10 | 3.4 |
| Becker County | 35,497 | 5 | 8 | 3.7 |
| Morrison County | 34,620 | under 3 | 6 | 2.3 |
| Nicollet County | 34,273 | 6 | 5 | 3.2 |
| Le Sueur County | 29,453 | 3 | 5 | 2.7 |
| Todd County | 26,060 | 4 | 3 | 2.7 |
| Meeker County | 23,603 | 5 | 3 | 3.4 |
| Dodge County | 21,376 | 3 | 5 | 3.7 |
| Waseca County | 18,688 | 5 | under 3 | 3.7 |
| Kanabec County | 16,628 | under 3 | 3 | 3 |
| Sibley County | 15,356 | under 3 | 3 | 3.3 |
| Renville County | 14,356 | under 3 | under 3 | 2.8 |
| Faribault County | 13,888 | 3 | under 3 | 3.6 |
| Lake County | 10,746 | under 3 | under 3 | 3.7 |
Highest gap scores among Minnesota counties with 10,000 or more residents
- 1Kanabec County+64
- 2Cottonwood County+58
- 3Renville County+50
- 4Faribault County+50
- 5Freeborn County+48
- 6Pine County+43
- 7Chippewa County+43
- 8Aitkin County+42
- 9Lake County+35
- 10Koochiching County+35
"Under 3" means the unpublished Census count is 0, 1, or 2. Kanabec County's gap score of +64 means it ranks much higher for legal need than for legal practices per resident.
Looking to expand your law firm in Minnesota? Pioneerly helps you develop a growth strategy and build a complete case acquisition system focused on the cases your firm wants more of.
How many active lawyers are there in Minnesota?
26,065 active lawyers live in Minnesota.
That's 44.7 per 10,000 residents, compared with 39.8 across the U.S. The count rose 0.9% over five years.
Source: American Bar Association, National Lawyer Population Survey 2025.
2,052 law offices with paid staff operate in Minnesota.
3,185 solo practices operate in Minnesota.
These are legal services businesses with no paid employees.
Lake County is about 86 miles from the nearest county with 7 or more legal practices per 10,000 residents
Straight-line distance from the center of each legal desert to the center of the nearest county with 7 or more legal practices per 10,000 residents, including neighboring states.
| County | Residents | Nearest county with 7 or more | Miles |
|---|---|---|---|
| Lake County | 10,746 | Douglas County, Wisconsin | 86 |
| Benton County | 41,744 | Crow Wing County | 54 |
| Waseca County | 18,688 | Dakota County | 52 |
| Dodge County | 21,376 | Dakota County | 46 |
| Kanabec County | 16,628 | Burnett County, Wisconsin | 45 |
| Meeker County | 23,603 | Carver County | 41 |
| Nicollet County | 34,273 | Carver County | 39 |
| Faribault County | 13,888 | Kossuth County, Iowa | 35 |
| Morrison County | 34,620 | Crow Wing County | 34 |
| Le Sueur County | 29,453 | Carver County | 31 |
| Becker County | 35,497 | Mahnomen County | 28 |
| Todd County | 26,060 | Douglas County | 28 |
| Renville County | 14,356 | Redwood County | 27 |
| Sibley County | 15,356 | Carver County | 27 |
| Winona County | 50,523 | Houston County | 26 |
Minnesota has more bankruptcy filings per resident than the U.S. as a whole
The six measures that make up the need for legal services, each tied to a practice area, with the county where it's highest among those with 10,000 or more residents.
Bankruptcy filings per 10,000 residents
BankruptcyHighest: Kanabec County, 30.7
Residents 65 and over
Estate planning and probateHighest: Aitkin County, 34.4%
Divorced or separated, age 15 and over
Family lawHighest: Carlton County, 14.6%
Residents below the poverty line
Housing and consumer debtHighest: Beltrami County, 16.1%
Fatal crashes a year per 100,000 residents
Personal injuryHighest: Kanabec County, 27.1
Residents born outside the U.S.
ImmigrationHighest: Nobles County, 21.3%
State and U.S. figures are county figures weighted by population. Fatal crashes are the yearly average for 2023 and 2024, and bankruptcy filings are for 2025.
30 of the 45 growing Minnesota counties lost law offices with staff
These counties gained residents from 2020 to 2025 and had fewer law offices with paid staff in 2023 than in 2018. The 8 fastest-growing are shown.
| County | Residents | Change since 2020 | Law offices, 2018 | Law offices, 2023 |
|---|---|---|---|---|
| Isanti County | 44,386 | +7.3% | 9 | 8 |
| Washington County | 286,895 | +6.9% | 102 | 101 |
| Sherburne County | 104,194 | +6.8% | 10 | 9 |
| Scott County | 159,017 | +5.1% | 20 | 17 |
| Anoka County | 381,605 | +4.7% | 53 | 42 |
| Hubbard County | 22,369 | +4.6% | 6 | 3 |
| Crow Wing County | 69,132 | +4.3% | 29 | 24 |
| Rice County | 69,939 | +4.2% | 19 | 17 |
Population change is July 2020 to July 2025, from the Census Population Estimates. Law offices with paid staff are from Census County Business Patterns, which publishes counts of 3 or more. The statewide office change covers the 63 counties with both counts published.
Which Minnesota counties have room for your firm to grow?
We can rank all 87 Minnesota counties by population growth, legal need, and the legal practices already there, for the practice areas your firm wants more of.
Contact usLegal practices in all 87 Minnesota counties
Sort by any column, or type a name to filter. Click a county to see it on the map.
| How much people in the county are likely to need a lawyer, from 0 (least in the U.S.) to 100 (most). | How far the need for legal help runs ahead of local legal practices. Above 0 means more need than practices. | |||
|---|---|---|---|---|
| Morrison County | 34,620 | 1.7 to 2.3 | 41.3 | +26.0 |
| Le Sueur County | 29,453 | 2.7 | 37.5 | +16.2 |
| Todd County | 26,060 | 2.7 | 41 | +24.1 |
| Renville County | 14,356 | 0 to 2.8 | 50.8 | +50.1 |
| Kanabec County | 16,628 | 1.8 to 3 | 56.6 | +64.2 |
| Nicollet County | 34,273 | 3.2 | 31.9 | +4.2 |
| Sibley County | 15,356 | 2 to 3.3 | 36 | +10.6 |
| Benton County | 41,744 | 3.4 | 39.9 | +18.0 |
| Meeker County | 23,603 | 3.4 | 31.6 | +2.7 |
| Faribault County | 13,888 | 2.2 to 3.6 | 52.4 | +49.9 |
| Winona County | 50,523 | 3.6 | 36.7 | +10.1 |
| Becker County | 35,497 | 3.7 | 45.2 | +29.7 |
| Dodge County | 21,376 | 3.7 | 32.2 | +1.2 |
| Lake County | 10,746 | 0 to 3.7 | 47.5 | +35.3 |
| Waseca County | 18,688 | 2.7 to 3.7 | 35.6 | +6.9 |
| Anoka County | 381,605 | 4 | 36.5 | +6.0 |
| Wright County | 157,559 | 4 | 30.9 | -3.1 |
| Isanti County | 44,386 | 4.1 | 37.4 | +6.7 |
| Mower County | 40,971 | 4.1 | 39.5 | +11.0 |
| Sherburne County | 104,194 | 4.1 | 32.8 | -1.4 |
| Yellow Medicine County | 9,477 | 0 to 4.2 | 29.1 | -7.2 |
| Clay County | 67,734 | 4.3 | 32.2 | -4.5 |
| Lyon County | 25,684 | 4.3 | 35 | +0.1 |
| Mille Lacs County | 27,753 | 4.3 | 45.7 | +25.3 |
| Pine County | 30,472 | 4.3 | 52.3 | +43.0 |
| Pennington County | 13,686 | 2.9 to 4.4 | 40.1 | +9.2 |
| Watonwan County | 11,459 | 2.6 to 4.4 | 47.3 | +27.9 |
| Marshall County | 8,798 | 0 to 4.5 | 28.9 | -10.8 |
| Steele County | 37,464 | 4.5 | 38 | +3.6 |
| Fillmore County | 21,540 | 4.6 | 34.8 | -3.7 |
| McLeod County | 36,631 | 4.6 | 45 | +19.9 |
| Polk County | 30,545 | 4.6 | 29.9 | -10.9 |
| Roseau County | 15,246 | 4.6 | 38.6 | +3.7 |
| Wabasha County | 21,537 | 4.6 | 35.5 | -2.5 |
| Beltrami County | 47,055 | 4.7 | 39.3 | +3.8 |
| Scott County | 159,017 | 4.7 | 29.3 | -12.9 |
| Goodhue County | 48,195 | 4.8 | 38.1 | +0.1 |
| Itasca County | 45,404 | 4.8 | 47.8 | +24.4 |
| Freeborn County | 30,440 | 4.9 | 57 | +47.8 |
| Olmsted County | 166,731 | 5 | 31.7 | -13.5 |
| Stevens County | 9,747 | 3.1 to 5.1 | 28.9 | -18.1 |
| Swift County | 9,763 | 3.1 to 5.1 | 45 | +13.8 |
| Cottonwood County | 11,405 | 3.5 to 5.3 | 63 | +57.9 |
| Kandiyohi County | 44,720 | 5.4 | 44.7 | +8.9 |
| Nobles County | 22,338 | 5.4 | 49.6 | +21.7 |
| Stearns County | 164,110 | 5.4 | 40.9 | -0.9 |
| Chippewa County | 12,406 | 5.6 | 58.5 | +42.9 |
| Martin County | 19,440 | 5.7 | 54.6 | +31.2 |
| Otter Tail County | 61,041 | 5.7 | 36.8 | -14.2 |
| Rice County | 69,939 | 5.7 | 40.9 | -5.4 |
| Clearwater County | 8,647 | 3.5 to 5.8 | 37 | -14.9 |
| Hubbard County | 22,369 | 5.8 | 42.2 | -3.0 |
| Brown County | 25,517 | 5.9 | 44.2 | +0.6 |
| Koochiching County | 11,587 | 4.3 to 6 | 57.5 | +34.9 |
| Lac qui Parle County | 6,704 | 0 to 6 | 41.1 | -8.8 |
| Chisago County | 59,142 | 6.1 | 30.2 | -30.4 |
| Pope County | 11,420 | 6.1 | 37.9 | -17.6 |
| Aitkin County | 16,252 | 6.2 | 61.5 | +42.1 |
| Murray County | 7,942 | 3.8 to 6.3 | 31.8 | -31.0 |
| Wadena County | 14,388 | 6.3 | 49.4 | +8.7 |
| St. Louis County | 200,518 | 6.4 | 44.9 | -3.9 |
| Wilkin County | 6,288 | 0 to 6.4 | 46 | -1.1 |
| Carlton County | 36,711 | 6.5 | 46.4 | -1.2 |
| Pipestone County | 9,260 | 4.3 to 6.5 | 37 | -24.0 |
| Grant County | 6,085 | 0 to 6.6 | 52.3 | +13.8 |
| Cass County | 31,430 | 6.7 | 48.4 | +1.6 |
| Blue Earth County | 70,634 | 6.8 | 35.8 | -30.1 |
| Houston County | 18,400 | 7.1 | 35.7 | -33.8 |
| Jackson County | 9,857 | 7.1 | 44.5 | -13.5 |
| Lincoln County | 5,583 | 0 to 7.2 | 32.8 | n/a |
| Rock County | 9,524 | 5.2 to 7.3 | 31.1 | n/a |
| Carver County | 114,379 | 7.4 | 26.3 | -48.6 |
| Crow Wing County | 69,132 | 7.5 | 41.6 | -24.8 |
| Douglas County | 40,120 | 7.5 | 33.5 | -41.6 |
| Big Stone County | 5,054 | 0 to 7.9 | 37.5 | n/a |
| Norman County | 6,336 | 4.7 to 7.9 | 42.8 | n/a |
| Redwood County | 15,265 | 7.9 | 42.9 | -25.5 |
| Dakota County | 457,710 | 9 | 34.2 | -53.3 |
| Cook County | 5,522 | 5.4 to 9.1 | 48.5 | n/a |
| Kittson County | 4,031 | 0 to 9.9 | 40 | n/a |
| Red Lake County | 3,940 | 0 to 10.2 | 30.5 | n/a |
| Washington County | 286,895 | 10.3 | 32.2 | -64.6 |
| Lake of the Woods County | 3,770 | 0 to 10.6 | 44.9 | n/a |
| Mahnomen County | 5,153 | 7.8 to 11.6 | 45.7 | -40.4 |
| Traverse County | 3,130 | 0 to 12.8 | 55.2 | n/a |
| Ramsey County | 541,623 | 13.9 | 43.6 | -52.1 |
| Hennepin County | 1,284,784 | 16.9 | 37.7 | -72.1 |
No match for that name.
The colored mark shows each county's class on the map. A range such as "1.7 to 2.3" for Morrison County means Census withholds a count under 3, so the rate is shown at both ends.
How Minnesota compares with its neighbors
Share of residents living in a county with fewer than 7 legal practices per 10,000 or no licensed attorneys. Minnesota ranks 3rd of 50 states and D.C., where 1st has the largest share.
- North Dakota60.5%
- Wisconsin57.4%
- Minnesota50.4%
- Iowa47.7%
- United States20.9%
- South Dakota16.5%
67 of the 87 counties in Minnesota, home to 2,940,197 people, have fewer than 7 legal practices per 10,000 residents or no licensed attorneys.
Questions about legal deserts in Minnesota
How many lawyers are there in Minnesota?
Minnesota has 26,065 active lawyers, according to the American Bar Association's 2025 count. That's 44.7 per 10,000 residents, compared with 39.8 across the U.S. The U.S. Census Bureau counts 2,052 law offices with paid staff and 3,185 solo practices in Minnesota.
Which Minnesota counties have the fewest legal practices per resident?
Among counties with a measurable rate, Le Sueur County (2.7), Todd County (2.7), and Nicollet County (3.2) have the fewest legal practices per 10,000 residents. The national rate is 12.9.
What is a legal desert?
A legal desert is a county with fewer than 4 legal practices per 10,000 residents, counting law offices with paid staff and solo practices. Minnesota has 15 legal deserts, home to 386,811 people, and Winona County is the largest, with 50,523 residents.
Which Minnesota county is farthest from a county with more legal practices?
Lake County, a legal desert, is about 86 miles in a straight line from Douglas County, Wisconsin, the nearest county with 7 or more legal practices per 10,000 residents.
Where do most Minnesota lawyers practice?
Hennepin, Ramsey, Dakota, and Washington counties have at least 69% of the legal practices in Minnesota, counting law offices with staff and solo practices, and 44% of its residents.
How does Minnesota compare with other states?
50.4% of Minnesotans live in a county with fewer than 7 legal practices per 10,000 residents or no licensed attorneys, compared with 20.9% of all Americans. Minnesota ranks 3rd of 50 states and D.C., where 1st has the largest share.
Have law offices in Minnesota kept up with population growth?
The population of Minnesota grew 2.1% from July 2020 to July 2025, and its law offices with paid staff fell 8.5% from 2018 to 2023. 45 Minnesota counties gained residents, and 30 of them had fewer law offices in 2023 than in 2018.
The CSV covers all 3,144 U.S. counties, including every Minnesota county. It's free to use with a link back to this page (CC BY 4.0).
Download the CSVPioneerly, Legal Deserts in Minnesota: Where Lawyers Are Scarce, pioneerly.com/us-legal-deserts/minnesota/. Journalists, researchers, and bar associations are welcome to use the figures and maps with this credit.
Expanding your law firm in Minnesota?
We help midsize law firms choose where to expand, reach local clients, and turn inquiries into signed cases and matters.